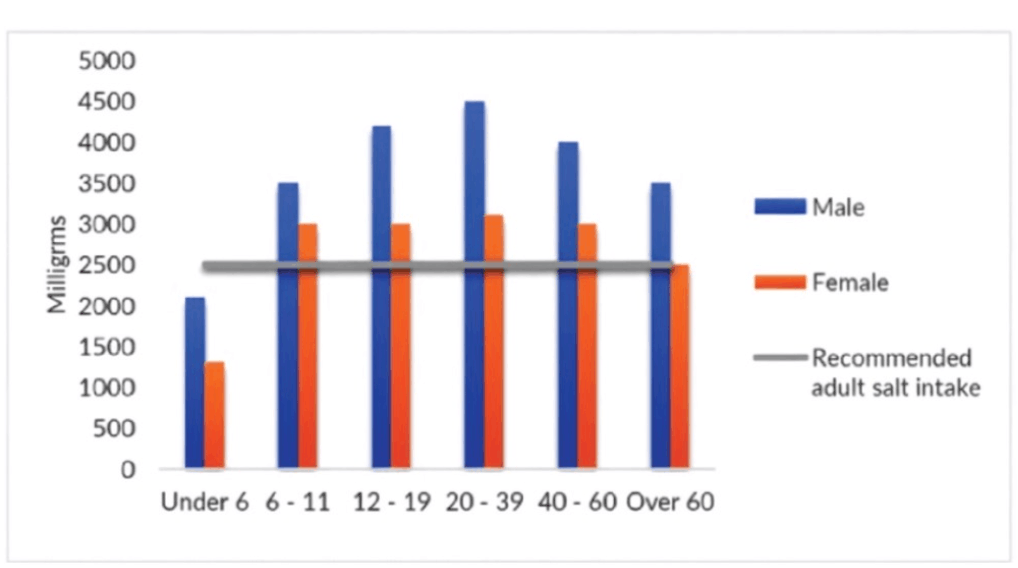
The chart shows the information about salt intake in the US in 2000
Practice this IELTS Writing Task 1 question on IELTSX. The chart shows the information about salt intake in the US in 2000
Salt Intake United States 2000 Chart - IELTS Writing Task 1
You should spend about 20 minutes on this task.
Summarise the information by selecting and reporting the main features, and make comparisons where relevant.
Write at least 150 words.
A student's answer to this task, and the feedback on it
Written by an IELTSX user under exam conditions and published unedited and anonymously. Band 8 · 189 words.
The bar graph illustrates the information about salt consumption in the US in 2000. Units are measured in milligrams (mg).
Overall, it is noticeable that men, especially those in middle age, consumed relatively high amounts of salt compared to women. In addition, the consumption rates were above the recommended adult salt intake (which was 2500 mg) for both genders, excluding those who were aged below 6.
Men aged 20-39 consumed the highest amount of salt, with 4500 mg, whereas women in the same age group absorbed 3000 mg. The intake of salt was relatively the same for women aged from 6 to 60, accounting for 3000 mg, and those who were aged over 60 consumed 2500 mg of salt. In contrast, the consumption rates for men aged 6 to 39 grew from around 3500 to 4500 before declining to approximately 3750 mg for men aged 40-60 and roughly 3250 mg for those who were aged over 60.
Only children aged under 6 consumed less amount of salt than the recommended intake: men consumed slightly above 2000 mg, whereas the numbers showed 1250 for women in the same age bracket.
Examiner feedback
This is a very strong response that satisfies all the requirements of the task. It provides a clear overview and supports it with accurate data comparisons. To reach Band 9, the candidate could focus on even more precise data synthesis (e.g., grouping age ranges more strictly as they appear on the X-axis) and avoiding slightly unnatural word choices like 'absorbed'.
Task Achievement - 8
- The response covers all key features of the chart, including the comparison between genders, age-specific trends, and the relationship to the recommended intake level. - A clear overview is provided, highlighting the main trends (men consuming more than women and most groups exceeding the recommended limit). - Data is used effectively to support the descriptions, although some age groupings in the third paragraph are slightly generalized.
Coherence & Cohesion - 8
- Information is organized logically, moving from a general overview to specific details for different demographic groups. - Cohesive devices (e.g., 'In addition', 'whereas', 'In contrast') are used effectively to signal transitions and comparisons. - Paragraphing is appropriate and contributes to the clarity of the report.
Lexical Resource - 8
- A wide range of vocabulary is used accurately (e.g., 'illustrates', 'noticeable', 'accounting for', 'age bracket'). - The term 'absorbed' is slightly unnatural in the context of dietary reporting; 'consumed' or 'intake' is more precise. - Minor issues with word choice ('less amount' should be 'a lower amount' or 'less salt') do not impede communication.
Grammatical Range & Accuracy - 8
- A variety of complex structures are used with high accuracy (e.g., 'those who were aged over 60', 'before declining to approximately...'). - Most sentences are error-free. - Punctuation is used correctly throughout the response.
Related prompts
- Male Female Students Art Related Subjects UK University 2011
- Town Centre Changes 1990 and Today
- Male Female Students High Grades Five Subjects Parston School National Average
- Qualifications Staff Advertising Company 1990 and 2010
- Australian School Leavers Activity 1980 1990 2000
- Layout Town Shopping Centre Present and Future Redevelopment