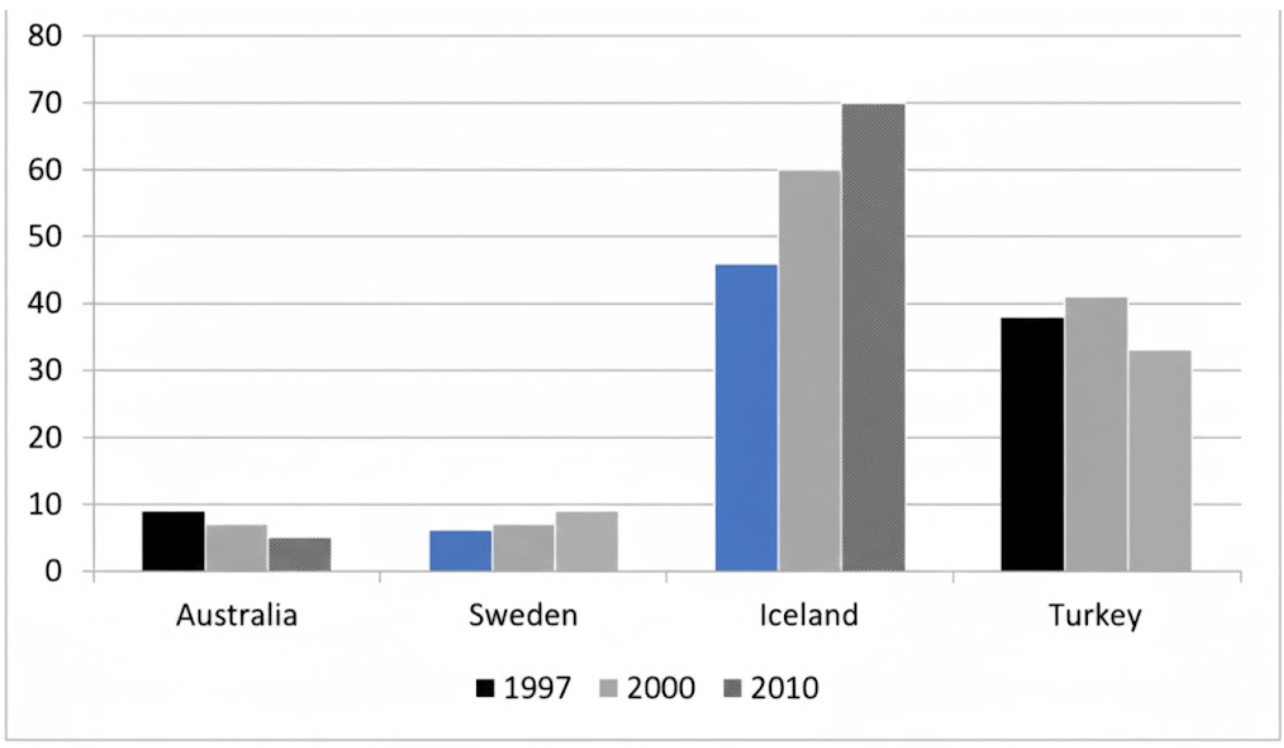
The chart shows the proportion of renewable energy in the total energy supply in 4 countries from 1997 to 2010
Practice this IELTS Writing Task 1 question on IELTSX. The chart shows the proportion of renewable energy in the total energy supply in 4 countries from 1997 to 2010
Proportion Renewable Energy Four Countries 1997-2010 Chart - IELTS Writing Task 1
You should spend about 20 minutes on this task.
Summarise the information by selecting and reporting the main features, and make comparisons where relevant.
Write at least 150 words.
A student's answer to this task, and the feedback on it
Written by an IELTSX user under exam conditions and published unedited and anonymously. Band 8.5 · 195 words.
The bar chart illustrates the percentage of renewable energy in the total energy supply in four countries - Australia, Sweden, Iceland and Turkey - in 1997, 2000 and 2010.
Overall, Iceland consistently recorded by far the highest shares of renewable energy and this proportion increased markedly over the period. By contrast, Australia had the lowest figures and experienced a gradual decline. Sweden showed a steady upward trend, while Turkey fluctuated slightly before falling by the end of the period.
In 1997, renewable energy sources accounted for 45% of total energy in Iceland, which is substantially higher than other countries. This figure rose significantly to 60% in 2000 and reached around 70% by 2010. Sweden, in comparison, had relatively small proportions at about 5%, in 1997, but then increased moderately to around 7% in 2000 and close to 9% by 2010.
The opposite pattern was observed in Australia, The share of renewable energy fell from 9% in 1997 to about 7% in 2000, before declining further to around 5% in 2010. Meanwhile, Turkey started at approximately 38% in 1997 and rose slightly to just over 40% afterwards, but the figure dropped to roughly 33% by 2010.
Examiner feedback
This is an excellent response that demonstrates a high level of proficiency in describing data. The analysis is clear, the data selection is precise, and the vocabulary is varied. The only minor area for improvement is punctuation control to ensure complex sentences are connected correctly.
Task Achievement - 9
The response fully satisfies the requirements of the task. It provides a clear and comprehensive introduction and a high-quality overview that identifies the main trends (Iceland's dominance and growth vs. Australia's decline). All key features, including the data for all four countries across the three time points, are clearly highlighted and supported with accurate figures. The selection of data is judicious, focusing on the most significant changes and comparisons.
Coherence & Cohesion - 9
The organization of the response is logical and follows a clear progression. The paragraphing is managed skillfully, grouping countries with similar or contrasting trends together (Iceland and Sweden as rising, Australia and Turkey as declining/fluctuating). Cohesive devices such as 'By contrast', 'In comparison', and 'Meanwhile' are used naturally and effectively to link ideas without being obtrusive.
Lexical Resource - 9
A wide range of vocabulary is used with precision and flexibility. Expressions like 'accounted for', 'increased markedly', 'fluctuated slightly', and 'recorded by far the highest shares' demonstrate a sophisticated control of lexical features appropriate for an academic report. There are no spelling errors or inappropriate collocations.
Grammatical Range & Accuracy - 8
The range of structures is wide and used with a high degree of accuracy. However, there is a minor punctuation error (a comma splice) in the final paragraph: 'The opposite pattern was observed in Australia, The share...' where a full stop or semicolon was required. This minor lapse prevents a Band 9 in this specific criterion, although the majority of sentences are error-free and complex.
Related prompts
- Male Female Students Art Related Subjects UK University 2011
- Town Centre Changes 1990 and Today
- Male Female Students High Grades Five Subjects Parston School National Average
- Qualifications Staff Advertising Company 1990 and 2010
- Australian School Leavers Activity 1980 1990 2000
- Layout Town Shopping Centre Present and Future Redevelopment